

Large language models (LLMs) can summarize data, but long text blocks still make it hard to see what matters. When we analyzed local food-franchise data for a marketing project with Garbanzo, we needed a way to show the story on one chart - fast.
The problem
We had a lot of signals: social followers, website/app presence, app downloads and reviews, average app rating, listings on delivery platforms, and food-review scores. An LLM could describe each point, but the output was lengthy and muddy. Decision-makers don’t want prose; they want a picture.
The simple fix: build one composite score
We combined the digital-presence metrics into a single Online Presence Score (we called it the Octagram Composite Score, shout-out to the Octagram! during the project). Here’s the lightweight recipe:
- Normalize each metric to a common scale (1-5).
Use min-max scaling so the lowest value maps to 1 and the highest to 5:score_1_5 = 1 + 4 * (x - min(x)) / (max(x) - min(x)) - Assign weights that reflect your goal.
We weighted social presence higher because this was a college-town market where students dominate demand. Ensure weights sum to 1. - Combine into a single number.
composite = Σ (w_i * score_i)
(Optionally rescale the composite for plotting to -1…1)composite_scaled = 2 * (composite - min) / (max - min) - 1 - Plot for insight.
We put food-review rating on one axis and the composite on the other. In one glance, you can spot franchises that customers love offline but barely see online and vice versa.
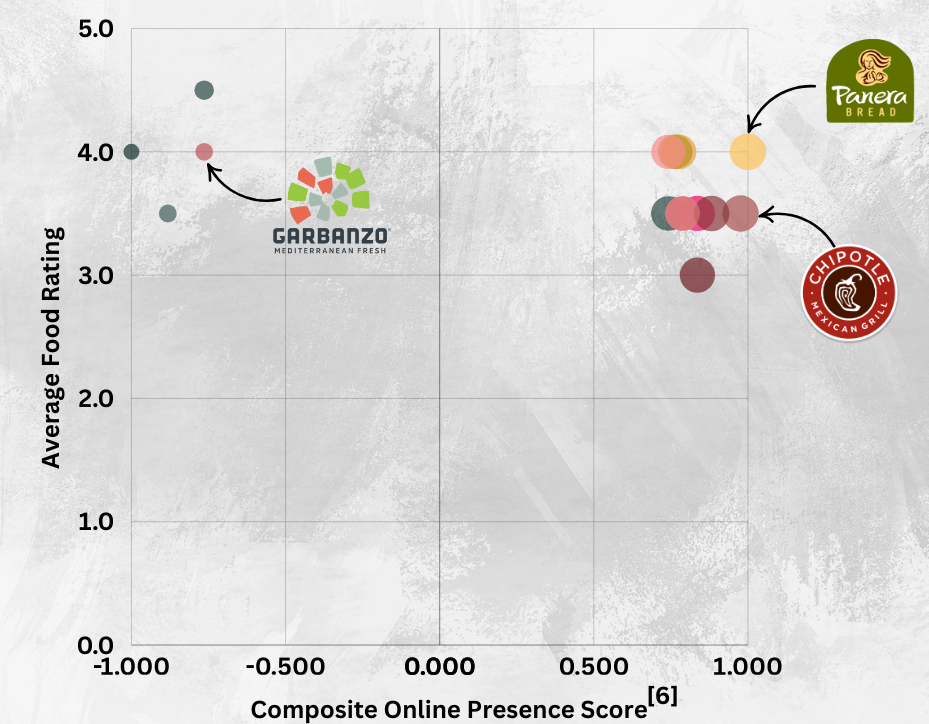
What the chart reveals
Even if a restaurant has a high average food rating, a weak online presence shows up immediately. That suggests clear next steps: strengthen the channels that lift the composite improve listings, encourage app reviews, optimize social content so visibility (and foot traffic) rises.
Why this beats an LLM-only summary
Text summaries are helpful for context, but they don’t rank options or expose trade-offs at a glance. A composite-plus-scatter makes prioritization obvious and defensible.
Steal this checklist
- Pick your metrics (social, app, delivery, etc.).
- Normalize to a common scale (1-5).
- Choose goal-aligned weights (sum to 1).
- Compute the composite.
- Plot composite vs. an outcome metric (e.g., food reviews).
- Make decisions by quadrant (leader, hidden gem, fixer-upper, hype risk).


Comments